Chapter 5 Spatial data
hello test
https://www.paulamoraga.com/book-geospatial/references.html
5.1 Vector data
5.2 Raster data
terra replaces raster https://github.com/rspatial/terra rspatial https://github.com/rspatial https://rspatial.org/# (predicts,)
5.3 Map projections - working with EPSG codes
5.4 Linking to GDAL and other geoprocessing software
5.4.1 installing GDAL
5.5 Constructing Atlantis
Although as consultants we can’t share client data to help illustrate our methods and points we can construct a data ‘fable’, in this a case a lost archipeligo of nation states called Atlantis. This section will walk through how Atlantis may be constructed, and in so doing highlight a range of spatial data manipulations that are available in R.
5.5.1 Atlantis emerges!
First, we need to source an island archipeligo and relocate it to the Indian Ocean. The middle of the Indian Ocean is located at 35\(^\circ\)S and 80\(^\circ\)E. The archipeligo we wish to source is the Croatian archipeligo, which with more than a 1,000 islands adds a little complexity to Atlantis. The benefit of a programming language such as R is that this scale of the archipeligo is not an issue. Indeed, a large scale archipeligo will highlight where solutions of scale may need to be applied.
We source a map of Croatia from the geosptdb package. The object croatia is of class sp (i.e., spatial polygons data frame), and is in the UTM 33N zone projection (or EPSG 32633). We want to both flip the Archipeligo upside down (including the mainland, which we will consider as the main ‘continent’), and reproject it into the Atlantean Standard Projection (ASP), which by coincidence happens to be UTM 44S zone projection (EPSG 32744: 78\(^\circ\)S to 84\(^\circ\)E, so we will actually recentre the map at 81\(^\circ\)E). But first we convert the sp object to a sf object, given our preference for working with the sf library. R-spatial provides tutorials on core data manipulations of spatially referenced vector objects, including affine transformations.
library(sf)
library(geosptdb)
library(rnaturalearth)

data(croatia) # load data from geosptdb

#  set crs
croatia <- st_as_sf(croatia) %>%
  st_set_crs(32633) %>% st_transform(32744)

#  projected coordinates of 81$^\circ$E, 35$^\circ$S
croatiaGeometry<-st_geometry(croatia)
croatiaCentroid<-st_centroid(croatiaGeometry)
croatiaExtent<-st_bbox(croatia)

#  centroid as sfc object computed from bounding box of ASP projection
atlantisCentroid <- st_point(c((833978.5569 - 166021.4431)/2  , (10000000.0000- 1116915.0440)/2 + 2500000))%>%
  st_sfc() %>%
  st_set_crs(32744)

#  a function to rotate a map
rot <- function(a) matrix(c(cos(a), sin(a), -sin(a), cos(a)), 2, 2)

#  now rotate the map
#  y = (x-b)*a + c. where a is the angle of rotation.
croatiaGeometry <- (croatiaGeometry - croatiaCentroid) * rot(pi/2) + atlantisCentroid
st_geometry(croatia)<-croatiaGeometry

sf_world <- rnaturalearth::ne_countries(returnclass='sf') %>% st_transform(32744)

#  check plot
plot(st_geometry(sf_world),xlim=c(-500000,1500000),ylim=c(1116915.0440,12000000.0000))
plot(croatiaGeometry, col = 'red', add = TRUE)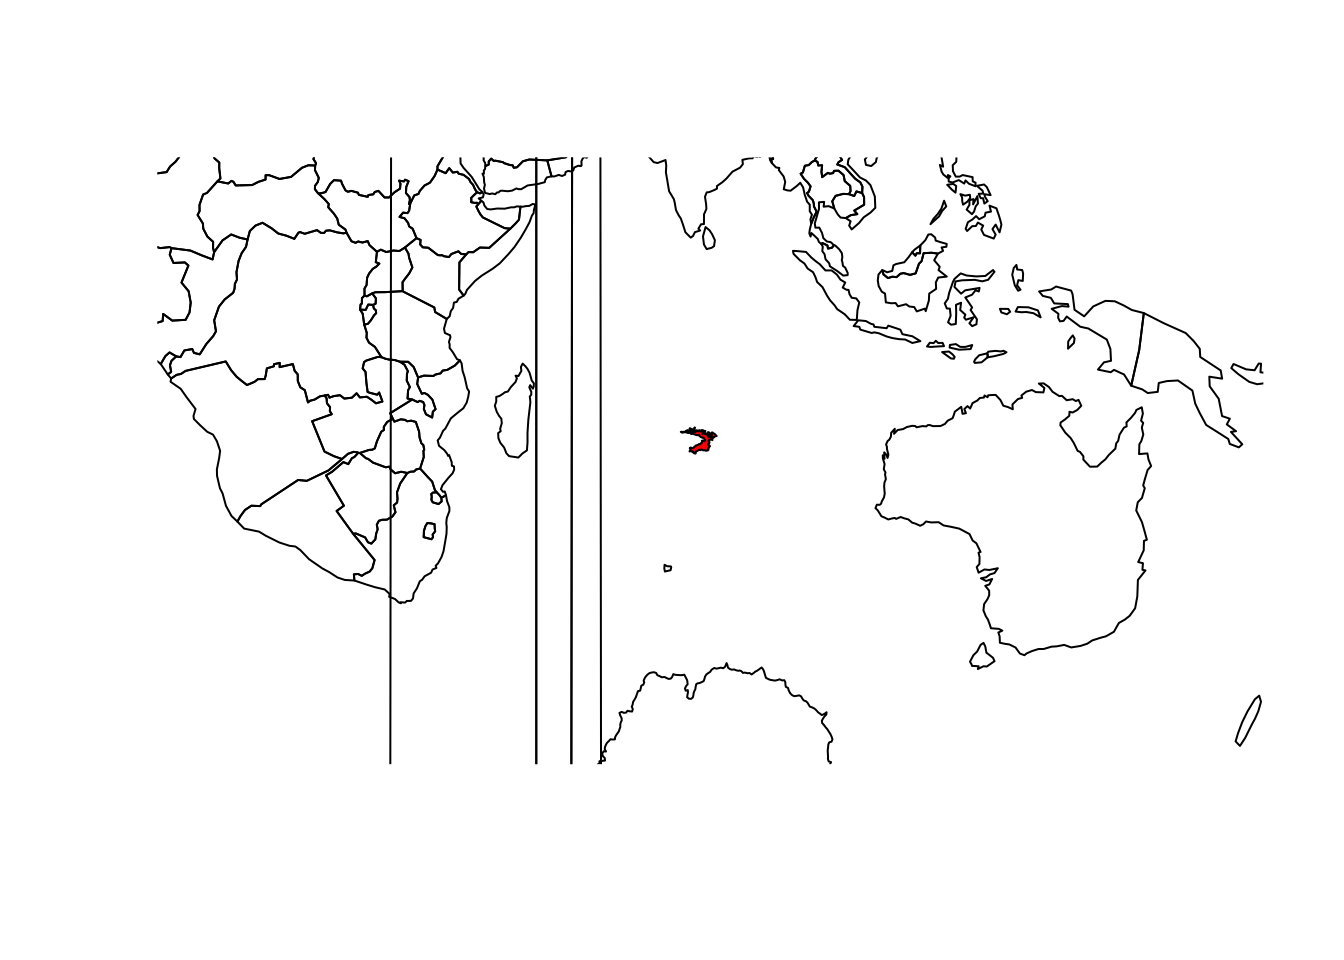
Figure 5.1: A check of where Atlantis has emerged!!
5.5.2 Providing Atlantis with a geography
We can see in Figure 5.1 that a mythical archipeligo of nation states called Atlantis has now arisen in the middle of the Indian Ocean (and looking much like an upside down map of Croatia, although upside down has always been a relative concept!!). We now need to assign a physical geography to Atlantis. We are going to cheat here and borrow the geography of Ghana. Why Ghana? Well the Ghana statistical service has readily available household survey data with which we can populate Atlantis. We do this by first resizing Atlantis to the size of Ghana, and then applying again an appropriate affine transformation to various geographical layers covering Ghana so these layers cover the resized Atlantis. The layers we are considering are elevation, administrative boundaries (down to level 2, including gazetted towns), a road network, water bodies, wildland reserves, land cover and a human population density map. These layers are typically available for any regional level epidemiological analysis. Data sources are commented on in the below code, and we introduce the raster package, and terraform which is beginning to supersede the raster package, to handle raster data.
We will rename all towns and administrative areas with Atlantean names sourced from Fantasy Name Generators via webscraping (an occasionally useful skill for epidemiologists collating data).
5.5.3 Populating Atlantis
5.6 Displaying map data
5.6.1 ggplot2
5.6.2 leaflet
5.6.3 interactive leaflet inside bookdown? flexdashboards?
5.7 TODO
- Convert initial croatia map from rnaturalearth library